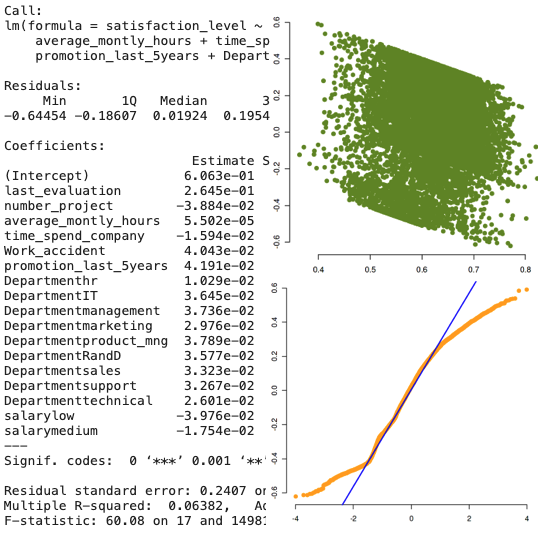
Multiple Linear Regression - Employee Satisfaction Level
Eploratory data analytics of a large set of HR data on Kaggle.com by Faisal Qureshi
to
understand
correlation and create a prediction model for response variable for 'Employee
Satisfaction Level' in relation to given predictors. Statistical analysis was
performed
through Multiple Linear Regression with R programming in Kaggle Notebooks using R
Markup.
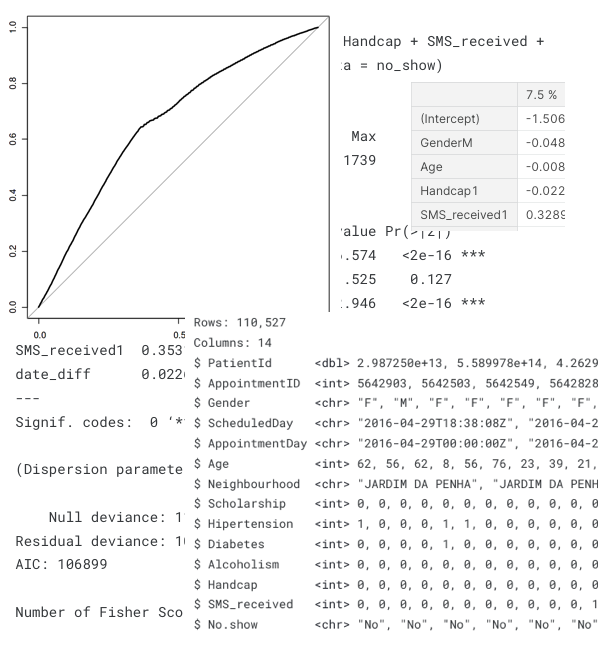
Logistic Regression - Medical Appointment No-Show
Exploratory Data Analysis of a large set of medical appointment data on Kaggle.com by
Marwan Diab to understand correlation and create a
prediction model for response variables in relation to given predictors. Statistical
analysis was performed through logical regression with R programming in Kaggle
Notebooks
using R Markup.
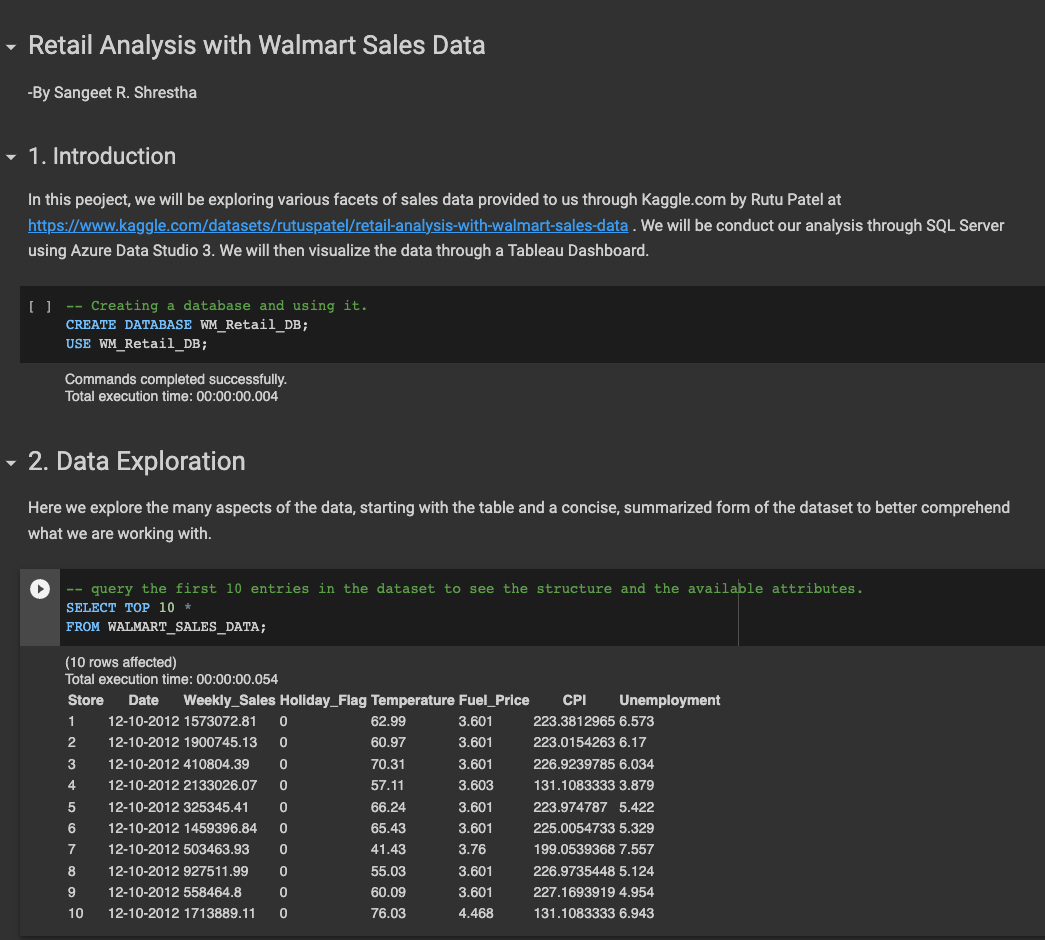
Retail Data Analysis
Retail Data Analysis of a big set of retail sales data based on a number of
parameters
including holiday events, temperature and CPI. Analysis was performed with SQL in
Azure
Data Studio 3 notebook and Docker.
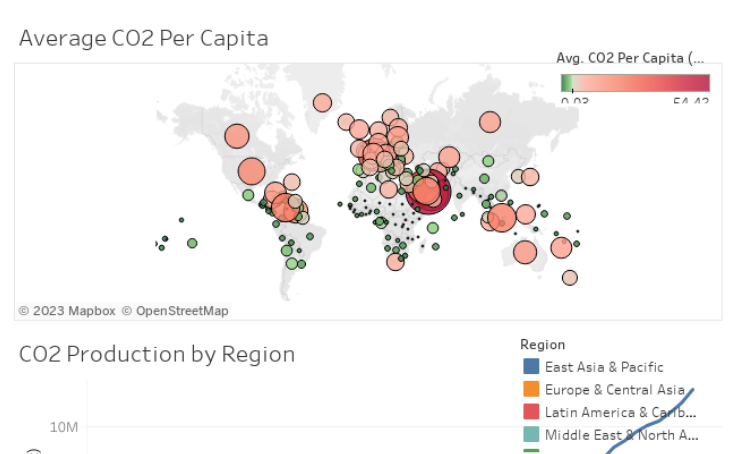
Global CO2 Emission Dashboard
A visualization project on global CO2 emissions data. The analysis was performed
visually
on Tableau using publicly available dataset.
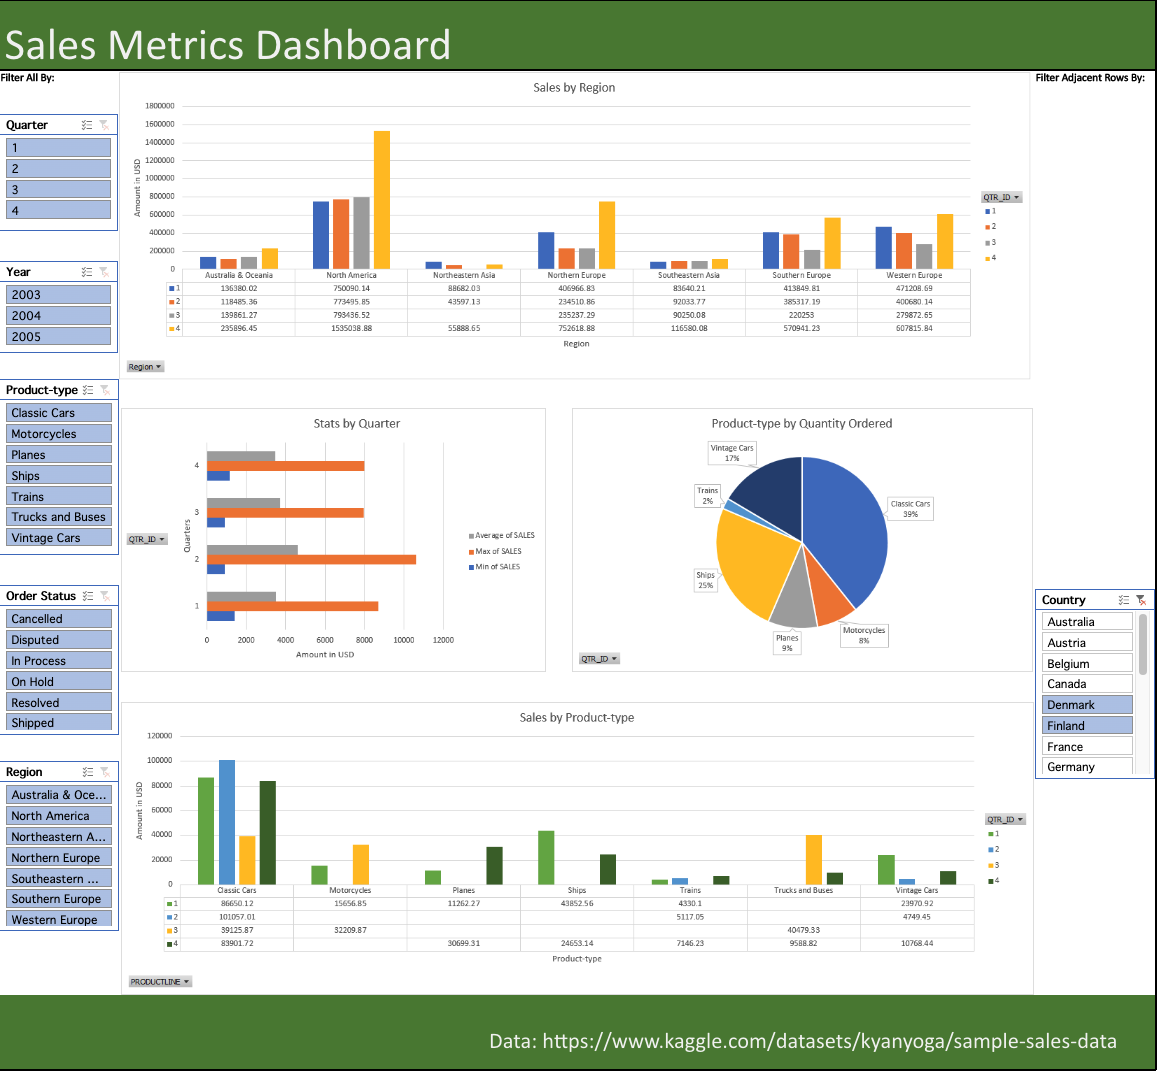
Sales Metrics Dashboard
A sales metrics dashboard created in Excel. This project utilizes various Excel
features
such as XLOOKUP, SUM, AVERAGE, MIN, MAX etc. Analysis is performed using Pivot
Tables
and visualized with pivot charts in an interactive dashboard.
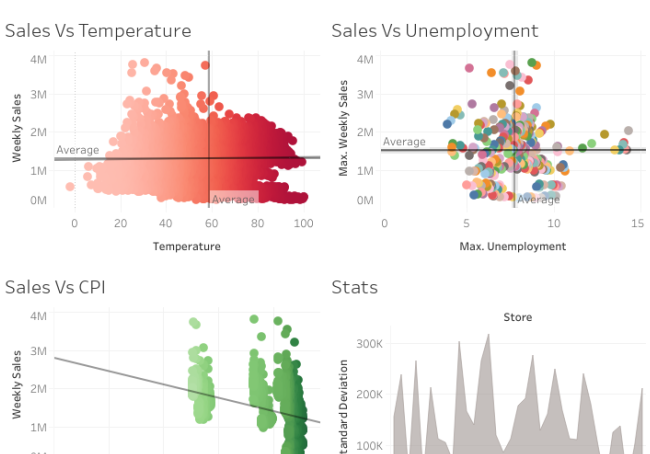
Walmart Sales Data 1 - Statistics
A sales statistics dashboard created in Tableau. This project utilizes Walmart Sales
Data
of approx. 6400+ rows of sales data from
Kaggle.com by Rutu Patel.
The data cleaning and analysis was performed with SQL using Azure Data Studio 3 and
Docker on MacOS. This is the statistical portion of the data viz on this
dataset.
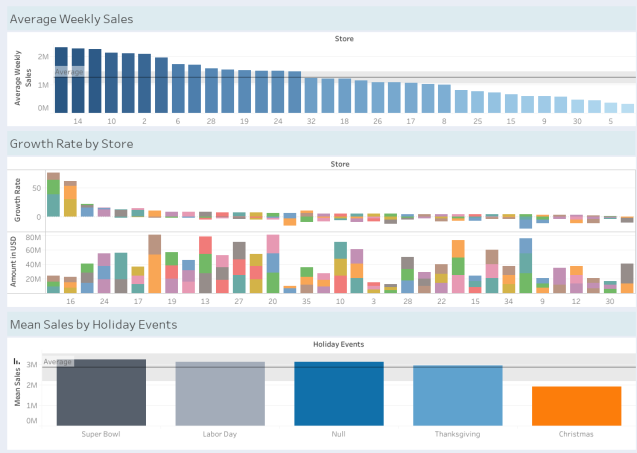
Walmart Sales Data 2 - Metrics
A sales statistics dashboard created in Tableau. This project utilizes Walmart Sales
Data
of approx. 6400+ rows of sales data from
Kaggle.com by Rutu Patel.
The data cleaning and analysis was performed with SQL using Azure Data Studio 3 and
Docker on MacOS. This is the metrics portion of the data viz on this
dataset.
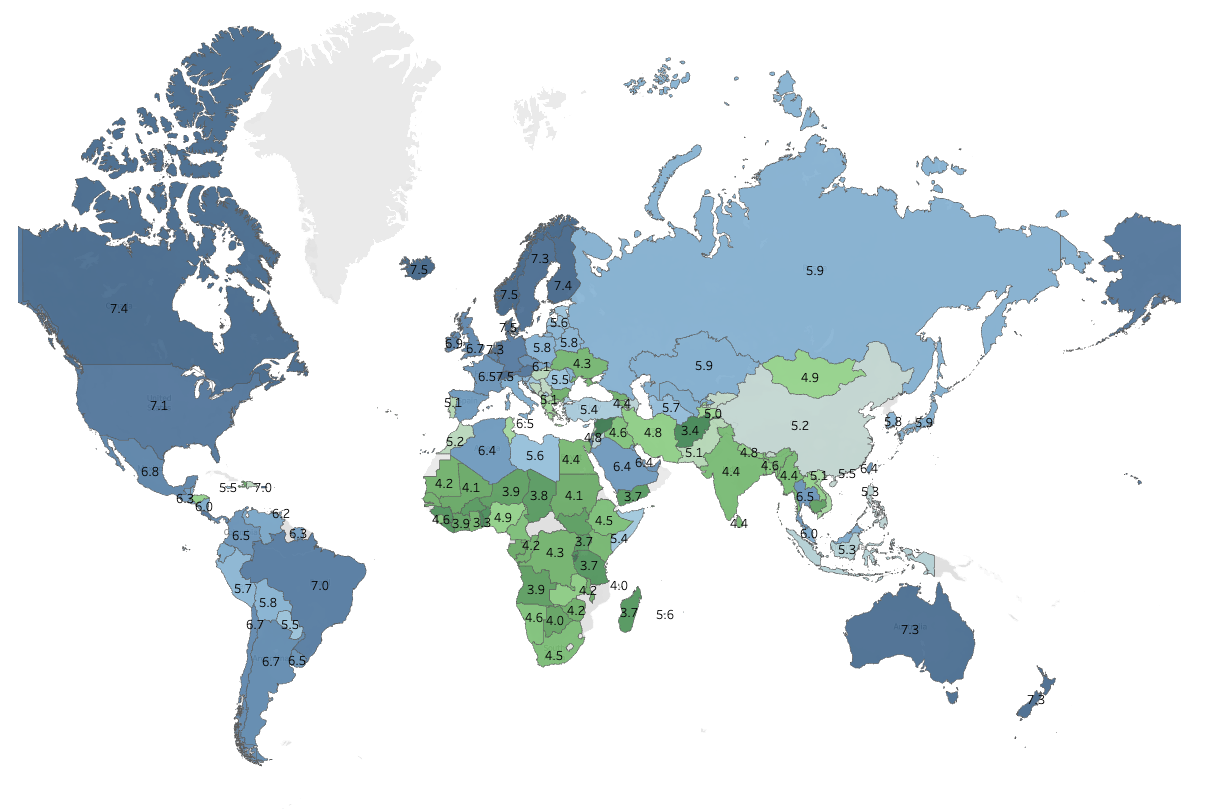
World Happiness Score Map
A visualization project on Global Happiness Score data. The analysis was performed
visually
on Tableau using publicly available dataset. In this analysis, we use MapBox api
through
Tableau to produce an interactive map dashboard to study the happiness score and
other
related variables.